ALHAMBRA B-band LF
The PROFUSE estimator and its application to the ALHAMBRA B-band LF is presented on López-Sanjuan et al. 2016.
The rest-frame B-band is well covered by extragalactic optical surveys, allowing the study of non-extrapolated luminosities up to z ~ 1 (see Beare et al. 2015 for a recent compilation of B-band luminosity functions).
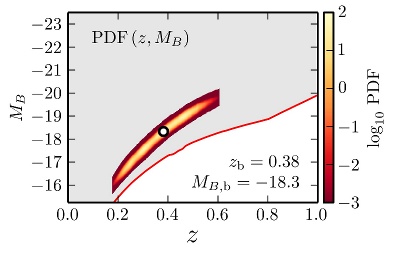
We compute the posterior luminosity function in ALHAMBRA using the redshift - spectral template and the I-band magnitude posteriors. We first derive the z - MB posterior of each ALHAMBRA source (see an example in Fig. 1), and combine them to estimate the ALHAMBRA LF of both quiescent and star-forming galaxies at 0.2 < z < 1.0. We compute the LF for three different photometric redshift priors (BPZ, constant, and cosmic volume) and redshift bin sizes (Δz = 0.05, 0.1, and 0.2). These derived LFs and their full covariance matrices are accessible here.
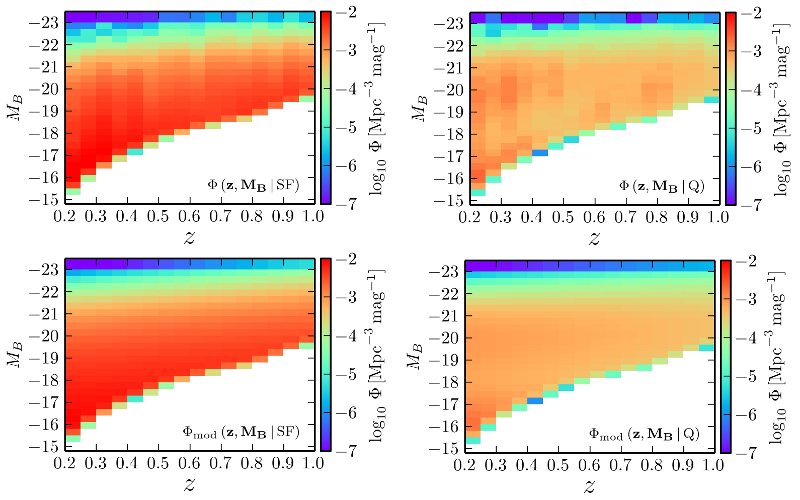
We present the ALHAMBRA luminosity functions, both for star-forming and quiescent galaxies, and our median models in Fig. 2. We modelled the observed LFs with redshift-dependent Schechter functions, one for star-forming galaxies and two for quiescent galaxies. The redshift-magnitude-galaxy type covariance matrices, including shot noise and cosmic variance, were used in the modelling.
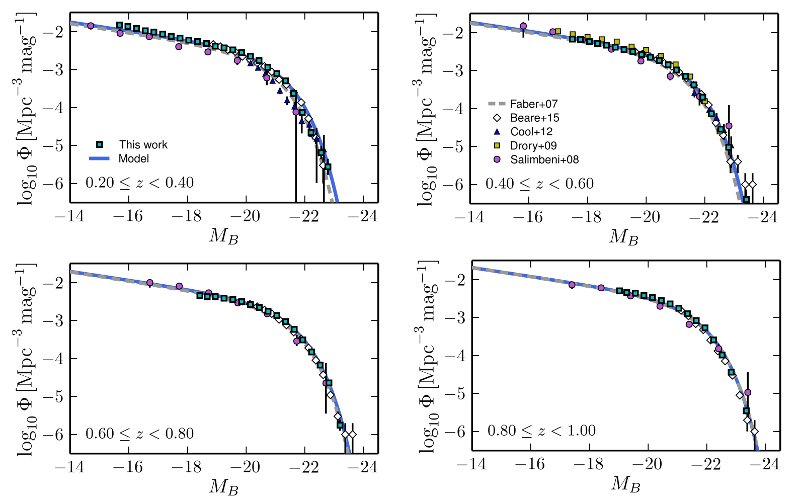
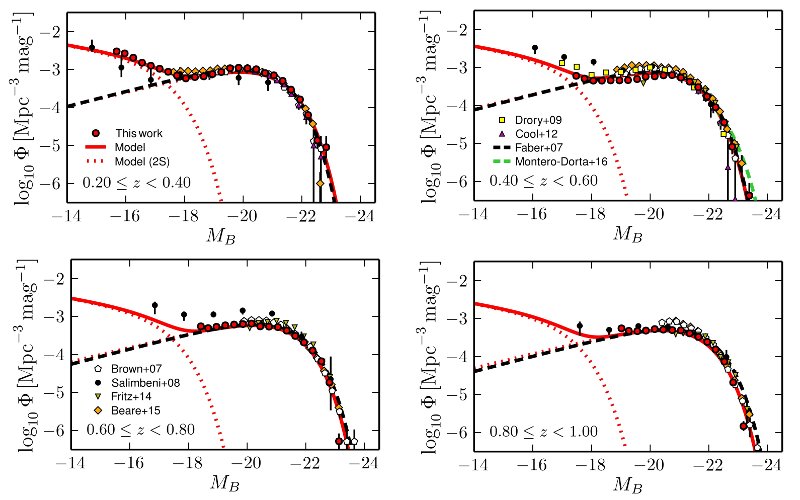
The comparison with previous work is presented in Figs. 3 and 4. The ALHAMBRA LFs nicely agree with the literature. We find a significant population of faint quiescent galaxies with MB > -18, modelled by a second Schechter function.
Finally, the redshift evolution of the Schechter function parameters and the derived luminosity density are also satisfactory, as shown in Figs. 5 and 6. The measured faint-end slopes are αSF = -1.29 ± 0.02 and αQ = -0.53 ± 0.04. The faint quiescent population has a characteristic magnitude Mf = -17.00 ± 0.09, slope β = -1.31 ± 0.11, and the same Φ* evolution than the bright population. The luminosity density of star-forming galaxies decreases by a factor 2.55 ± 0.14 since z = 1 to the present, and the luminosity density of quiescent galaxies increases by a factor 1.25 ± 0.16 in the same time lapse.
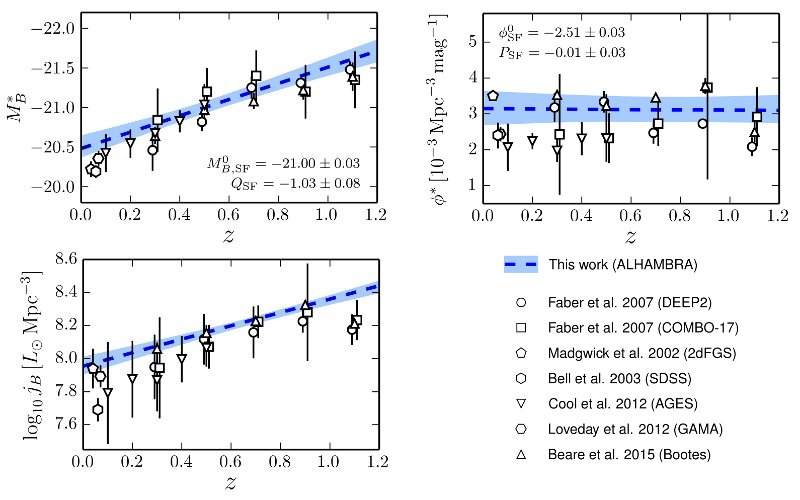
Figure 5 – Redshift evolution for star-forming galaxies of MB* ∝ QSF z (top left panel), Φ* ∝ 10{PSF z} (top right panel), and the B-band luminosity density jB (bottom left panel). In all panels the blue dashed line show the median model from ALHAMBRA data, with the coloured areas enclosing 95% of the solutions. The median of the parameters with their associated 68% (1σ) probability intervals are labelled in the panels. The other symbols, labelled in the bottom right panel, are from the literature. Their error bars mark 2σ confidence intervals.
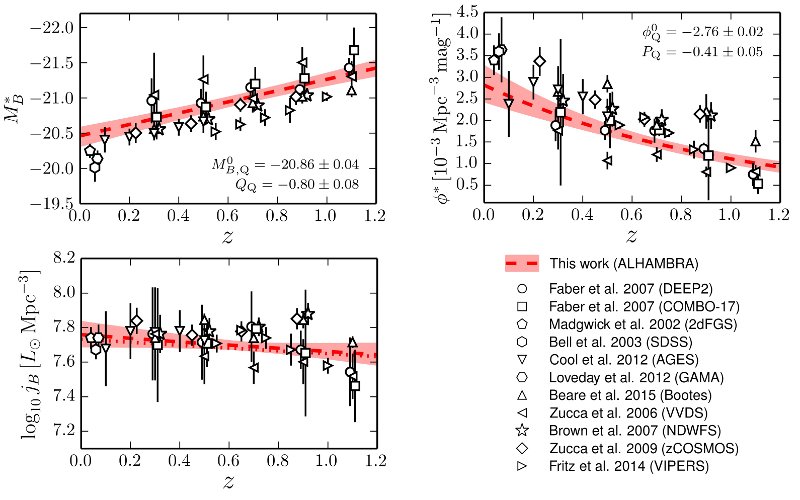
Figure 6 – The same as previous figure, but for quiescent galaxies. In all panels the red dashed line show the median model from ALHAMBRA data, with the coloured areas enclosing 95% of the solutions. The red dotted line in the bottom left panel shows the median model for the bright Schechter component alone.
In addition to the B-band luminosity function, we also measured the galaxy bias function both for star-forming and quiescent galaxies. The results are summarised here.


